Video Notes
Learn the basics of creating data visualizations with ggplot2. Includes examples of bar charts, histograms, box plots, and density plots. Covers ggplot2 fundamentals such as mappings, aesthetics, layers, labels, and facet wrapping. Learn to visualize distributions and relationships for both categorical and numerical variables.
Get the Book - R for Data Science
Chapters
Video Table of Contents
- 00:00 Introduction
- 01:18 Package setup
- 02:34 Penguins data frame
- 06:00 Accessing documentation
- 07:17 First scatter plot
- 11:00 NA values
- 11:51 Mapping variable to color
- 12:44 Linear regression line
- 14:16 Multi-line commands
- 15:16 Add color blind friendly shapes
- 15:45 Customize labels
- 16:44 Check in and revisiting documentation
- 18:01 Exercises
- 18:25 ggplot2 calls and omitting argument names
- 20:16 Categorical variable bar chart
- 21:26 Numerical variable histogram
- 22:33 Numerical variable density plot
- 22:49 Numerical and categorical variable - box plot and density plot
- 24:39 Two categorical variables - stacked bar chart
- 26:23 Two numerical variables - scatter plot
- 26:51 Three or more variables - subplots via facets
- 28:42 Plot wrap-up
- 29:02 Saving your plots
- 31:16 Common problems
- 33:37 Summary
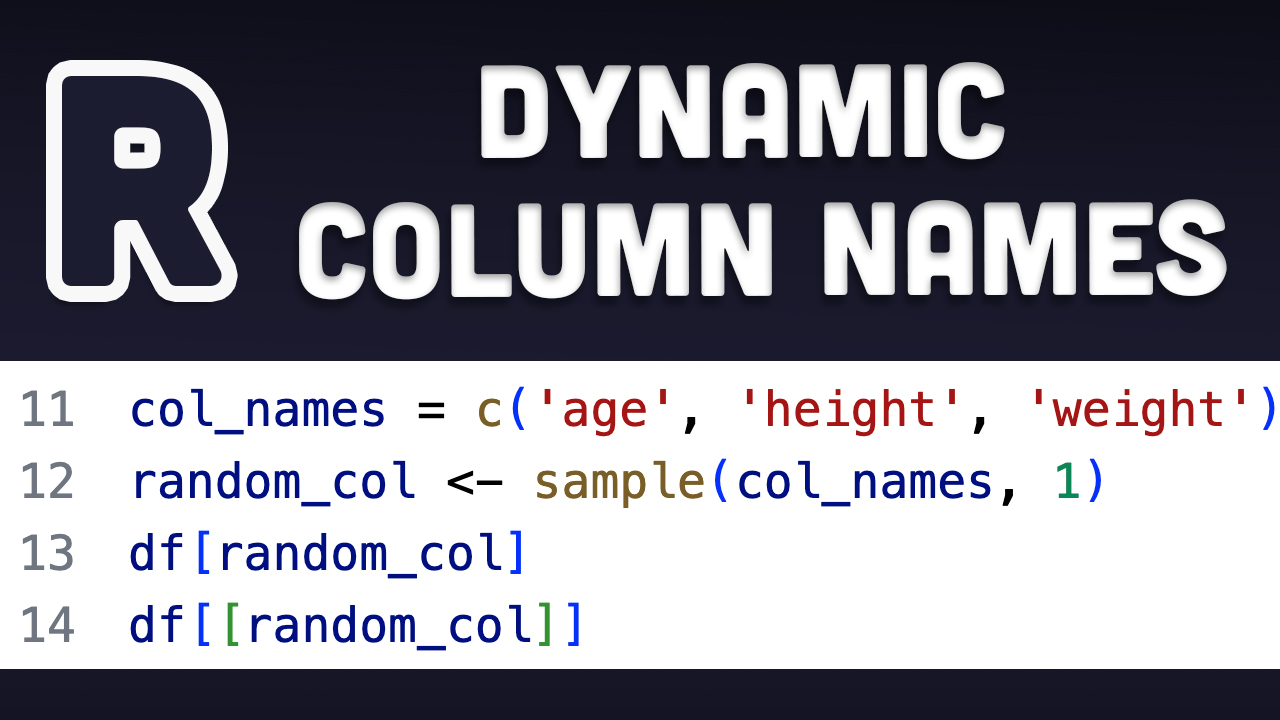 Dynamically Select Columns from Variables in R
 Custom Functions in R
 R Replace NA values with 0