New to R? The above video get you up and running with R and RStudio fast. Below is a summary of key points and code samples.
Visit https://posit.co/download/rstudio-desktop/ and follow the links to download installers for both R and RStudio.
The R installer includes a simple R console and editor you can use to write and run R code. However, many R developers opt to use RStudio, a robust code editor program designed to work with R.
RStudio depends on the R install, so that is why we’re installing both.
RStudio is split up into 4 panes, and each pane has different tabs you can access.

There are three primary ways you’ll execute code when working in RStudio:

To speed up your workflow, get familiar with the following keyboard shortcuts:
Mac
Windows
Full RStudio keyboard shortcut reference here...
# Assigning values
x <- 10

# Printing output
print(x)

# Load the documentation for a function
?plot

# See all available built-in R functions
ls("package.base")
x_values <- 1:5
y_values <- x_values^2
plot(x_values, y_values,
     xlab = "X Values",
     ylab = "Y Values",
     col = "blue",
     main = "Example Plot")
The site r-packages-io is a useful resource for browsing/discovering packages. Below is an example installing and using the package ggplot2.
Install the ggplot2 package:
install.packages("ggplot2")
Load the library:
library(ggplot2)
Example usage:
# Define a data frame of example data
df <- data.frame(
  x = c(1, 2, 3, 4, 5),
  y = c(2, 4, 6, 8, 10)
)

# Generate visualization
ggplot(df, aes(x = x, y = y)) +
  geom_point(color = "blue", size = 3) +
  geom_smooth(method = "lm", se = FALSE, color = "red") +
  labs(title = "Scatter Plot with Regression Line", x = "X-Axis", y = "Y-Axis") +
  theme_minimal()
num_var <- 10.5 # Numeric (double)
char_var <- "Hello" # Character
bool_var <- TRUE # Logical (Boolean)
# Vectors (1D, Same-type Data)
vec <- c(1, 2, 3, 4, 5) # Numeric vector
char_vec <- c("A", "B", "C") # Character vector
log_vec <- c(TRUE, FALSE, TRUE) # Logical vector

# Vector operations
vec*2 # x2 is applied to each element in the vector, yielding 2 4 6 8 10

## Lists
my_list <- list(10, "R", TRUE, c(1, 2, 3)) # Mixed data types
my_list[[2]] # Access second element

## Matrices (2D, Same-type Data)
mat <- matrix(1:9, nrow=3, ncol=3)
mat[2,3]  # Access row 2, column 3

## Data Frames (Tabular Data, Mixed Column Types)
df <- data.frame(Name = c("Alice", "Bob"), Age = c(25, 30), Score = c(90.5, 88.2))
head(df) # View first few rows
df$Name # Access column

## Factors (Categorical Data)
colors <- factor(c("red", "blue", "red", "green"))
levels(colors)  # Check factor levels
# Conditionals
if (x > 10) {
  print("Greater than 10")
} else {
  print("10 or less")
}

# for loops
for (i in 1:5) {
  print(i)
}

# while loops
x <- 1
while (x <= 5) {
  print(x)
  x <- x + 1
}

# functions
my_function <- function(a, b) {
  return(a + b)
}

my_function(5, 10)  # Returns 15
df <- read.csv("data.csv") # Read CSV
write.csv(df, "output.csv") # Write CSV
No subscriptions, no auto-renewals.
Just a simple one-time payment that helps support my free, to-the-point videos without sponsered ads.
Unlocking gets you access to the notes for this video plus all 200+ guides on this site.
Your support is appreciated. Thank you!
 R Error in setwd() - cannot change working directory
 R Vector Operations and Loops
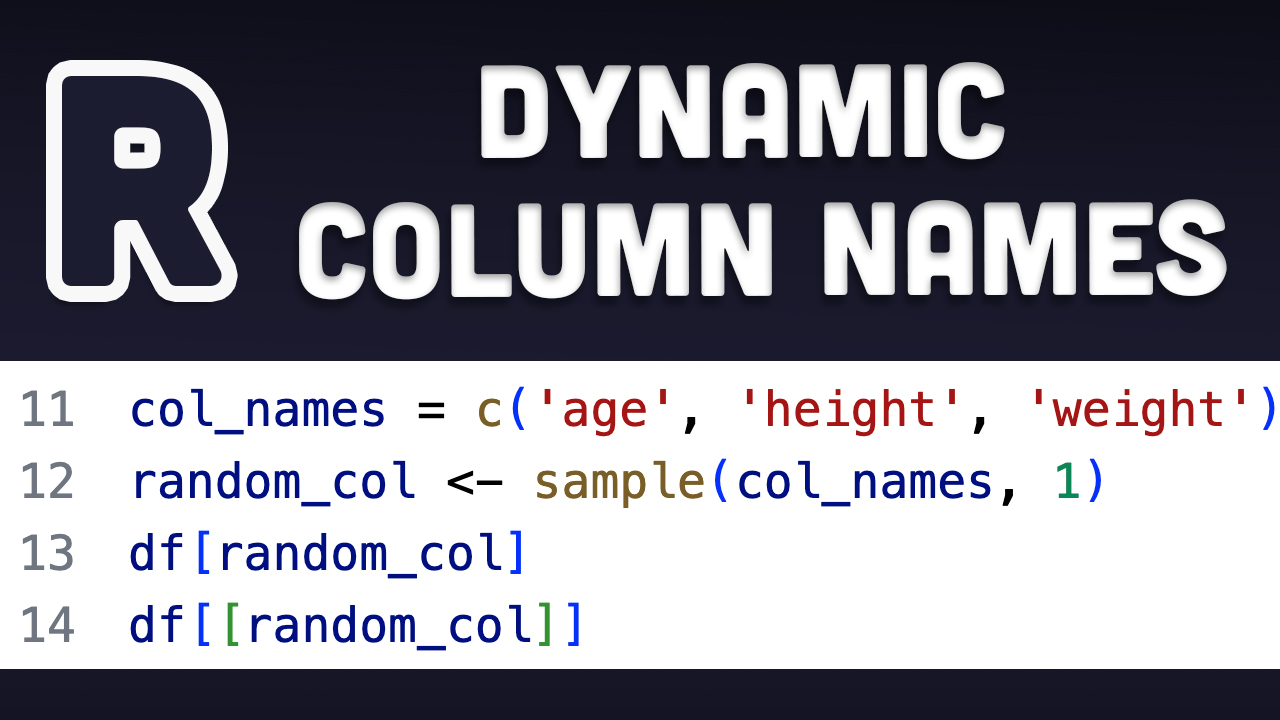 Dynamically Select Columns from Variables in R