The {targets} package helps you build reproducible, scalable data analysis pipelines in R. Instead of running scripts manually from top to bottom, {targets} lets you define your workflow as a series of steps with explicit dependencies.
It then tracks what depends on what, detects what changed, and re-runs only what is necessary.
This makes your projects faster, cleaner, and reproducible.
{targets} is especially useful when:
For small, one-off scripts, {targets} may be unnecessary. But for multi-step, iterative projects, it provides structure and safety.
A target is an object produced by your workflow.
It could be a cleaned dataset, a trained model, a plot, a report, etc.
Each target declares its dependencies. {targets} builds a dependency graph and only re-runs targets affected by changes.
For an example, we will set up a pipeline to:
To begin, install the {targets} package:
install.packages("targets")
In your project directory, create a file named _targets.R. This file defines your pipeline.
library(targets)

# Declare packages used in the pipeline
tar_option_set(packages = c("dplyr", "ggplot2"))

# List steps of your pipeline
list(

  # Step 1: Register the data file
  tar_target(file, "data/scores.csv", format = "file"),

  # Step 2: Load raw student data
  tar_target(
    scores_raw,
    read.csv(file)
  ),

  # Step 3: Remove students missing final exam scores
  tar_target(
    scores,
    scores_raw %>%
      filter(!is.na(final_score))
  ),

  # Step 4: Fit regression model (predict final exam score from study hours)
  tar_target(
    model,
    lm(final_score ~ study_hours, data = scores)
  ),

  # Step 5: Generate plot
  tar_target(
    plot,
    ggplot(scores, aes(x = study_hours, y = final_score)) +
      geom_point() +
      geom_smooth(method = "lm", se = FALSE) +
      labs(
        title = "Final Exam Score vs. Study Hours",
        x = "Study Hours",
        y = "Final Exam Score"
      )
  )
)
Observe that each tar_target() defines:
Dependencies are detected automatically. E.g. Both model and plot depends on scores, and scores depends on scores_raw.
To execute the pipeline, run the command:
tar_make()
Upon execution, the {targets} package will check which targets are outdated and run only those. It will skip everything else that is already up to date. For example, If you change only the modeling code, only model re-runs.
Results are stored in the _targets/ directory, not in your global environment.
To retrieve a result:
tar_read(plot)
To load it into your workspace:
tar_load(plot)
To re-run a specific target and its downstream dependencies:
tar_invalidate(model)
tar_make()
To rebuild everything:
tar_destroy(destroy = "objects")
tar_make()
As projects grow, placing all code directly in _targets.R becomes hard to maintain. A better approach is to move computation into functions stored in an R/ directory.
For example, create R/generate_plot.R:
generate_plot <- function(data) {
  ggplot(data, aes(x = study_hours, y = final_score)) +
    geom_point() +
    geom_smooth(method = "lm", se = FALSE) +
    labs(
      title = "Final Exam Score vs. Study Hours",
      x = "Study Hours",
      y = "Final Exam Score"
    )
}
Then add tar_source() to _targets.R before your pipeline:
tar_source()
Then, update the plot target:
tar_target(
    plot,
    generate_plot(clean_data)
  )
To see the dependency graph, run:
tar_visnetwork()
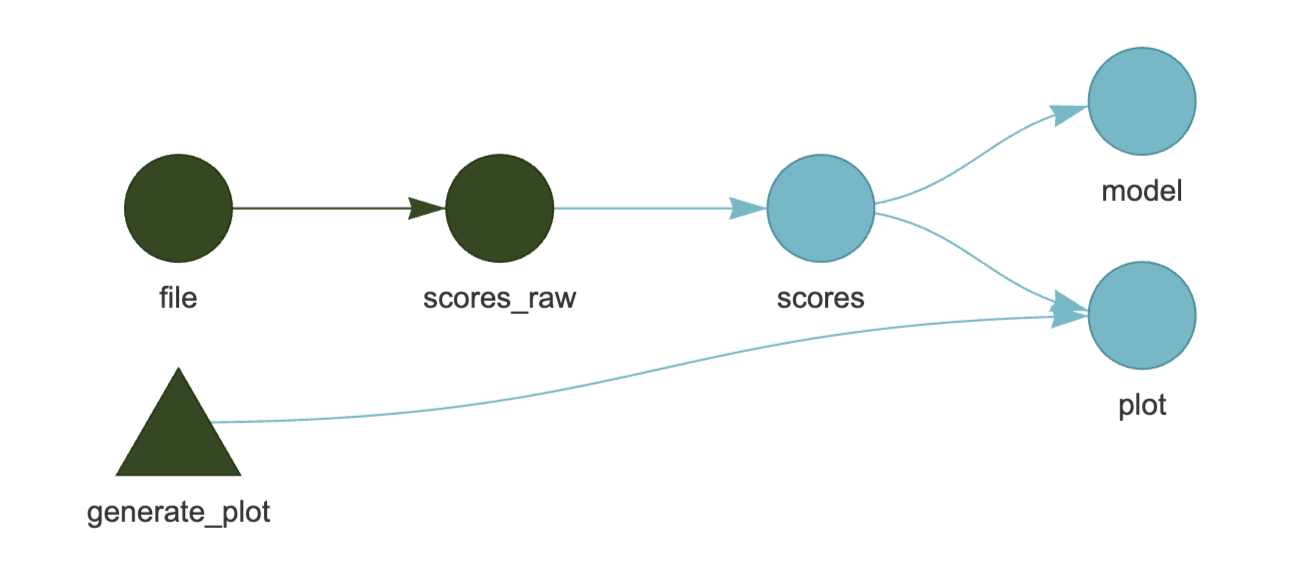
This shows how targets connect. It is useful for understanding and debugging your pipeline structure.
Green: up to date Blue: Outdated and needs to run
You can also see a summary of target commands via:
tar_manifest(fields = all_of("command"))
Example:
> tar_manifest(fields = all_of("command"))
# A tibble: 5 × 2
  name       command
  <chr>      <chr>
1 file       "\"data/scores.csv\""
2 scores_raw "read.csv(file)"
3 scores     "scores_raw %>% filter(!is.na(final_score))"
4 plot       "generate_plot(scores)"
5 model      "lm(final_score ~ study_hours, data = scores)"
targets.R_:
library(targets)

# Declare packages used in the pipeline
tar_option_set(packages = c("dplyr", "ggplot2"))

tar_source()

# List steps of your pipeline
list(
  # Step 1: Register the data file
  tar_target(file, "data/scores.csv", format = "file"),

  # Step 2: Load raw student data
  tar_target(
    scores_raw,
    read.csv(file)
  ),

  # Step 3: Remove students missing final exam scores
  tar_target(
    scores,
    scores_raw %>%
      filter(!is.na(final_score)) %>%
      filter(final_score < max(final_score, na.rm = TRUE))
  ),

  # Step 4: Fit regression model (predict final exam score from study hours)
  tar_target(
    model,
    lm(final_score ~ study_hours, data = scores)
  ),

  # Step 5: Generate plot
  tar_target(
    plot,
    generate_plot(scores)
  )
)
R/generate_plot.r:
generate_plot <- function(scores) {
  ggplot(scores, aes(x = study_hours, y = final_score)) +
    geom_point() +
    geom_smooth(method = "lm", se = FALSE) +
    labs(
      title = "Final Exam Score vs Study Hours",
      x = "Study Hours",
      y = "Final Exam Score"
    )
}
No subscriptions, no auto-renewals.
Just a simple one-time payment that helps support my free, to-the-point videos without sponsered ads.
Unlocking gets you access to the notes for this video plus all 200+ guides on this site.
Your support is appreciated. Thank you!
 R for Data Science - Workflow Basics (3)
 Import and Clean Data (R Simplified)
 R Quick Start