This guide covers wow to publish a Quarto report for free on Github Pages, making it publicly available online for free. We’ll be working in Positron.
Preface Guide: How to Create Quarto Documents in Positron
Create a new repository on Github.com, initialized with a README file.
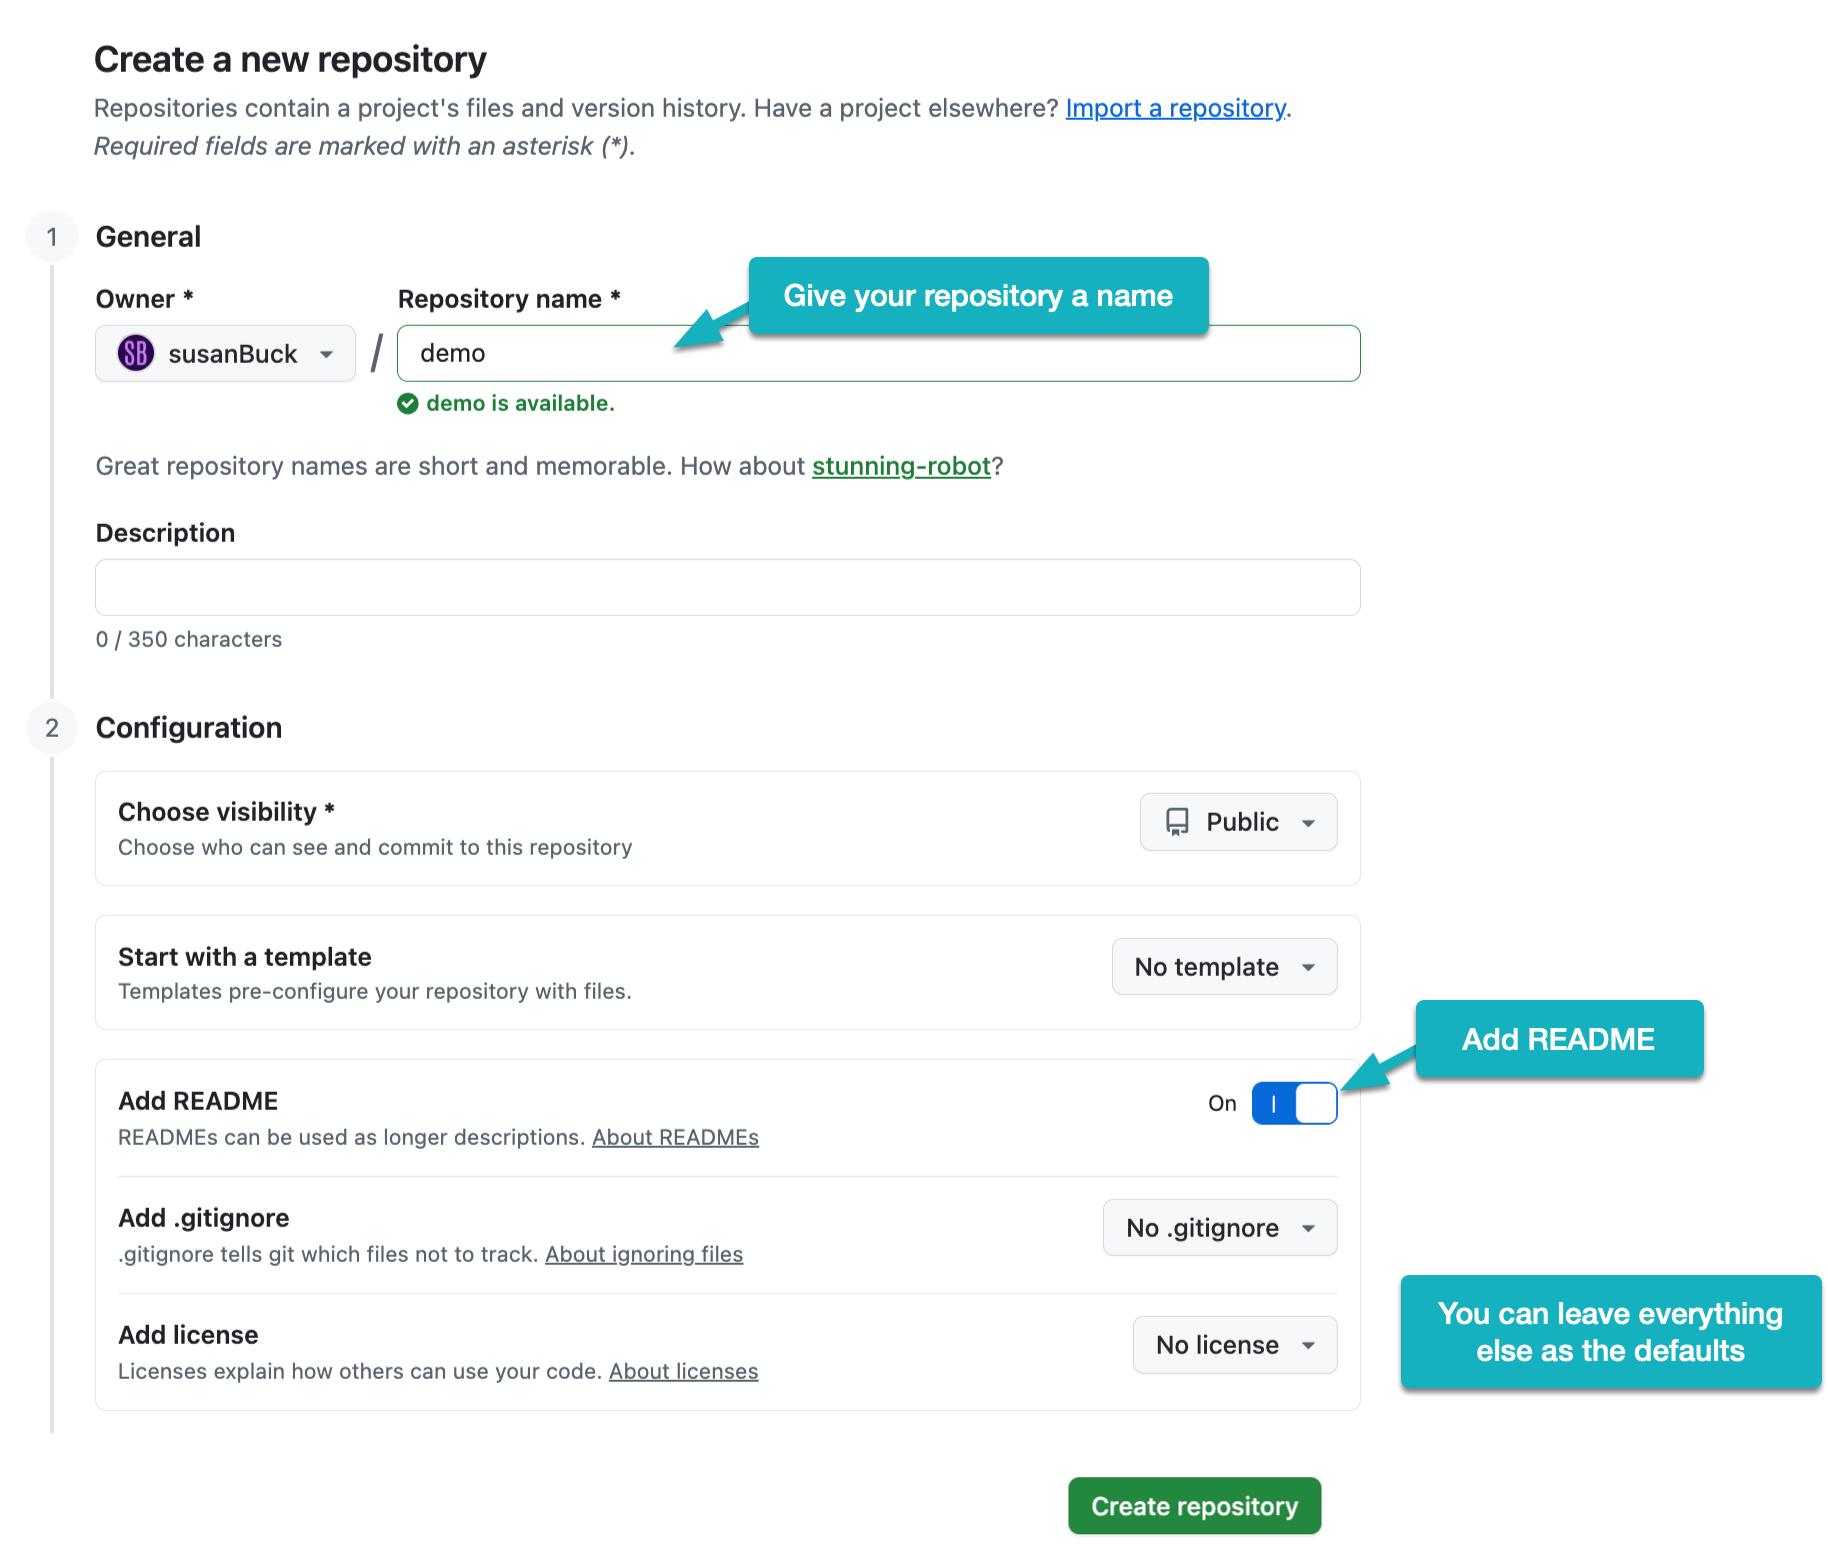
In the video, I name my repository demo and the resulting URL is https://github.com/susanBuck/demo. Make note of this URL as you’ll need it in Step 3.
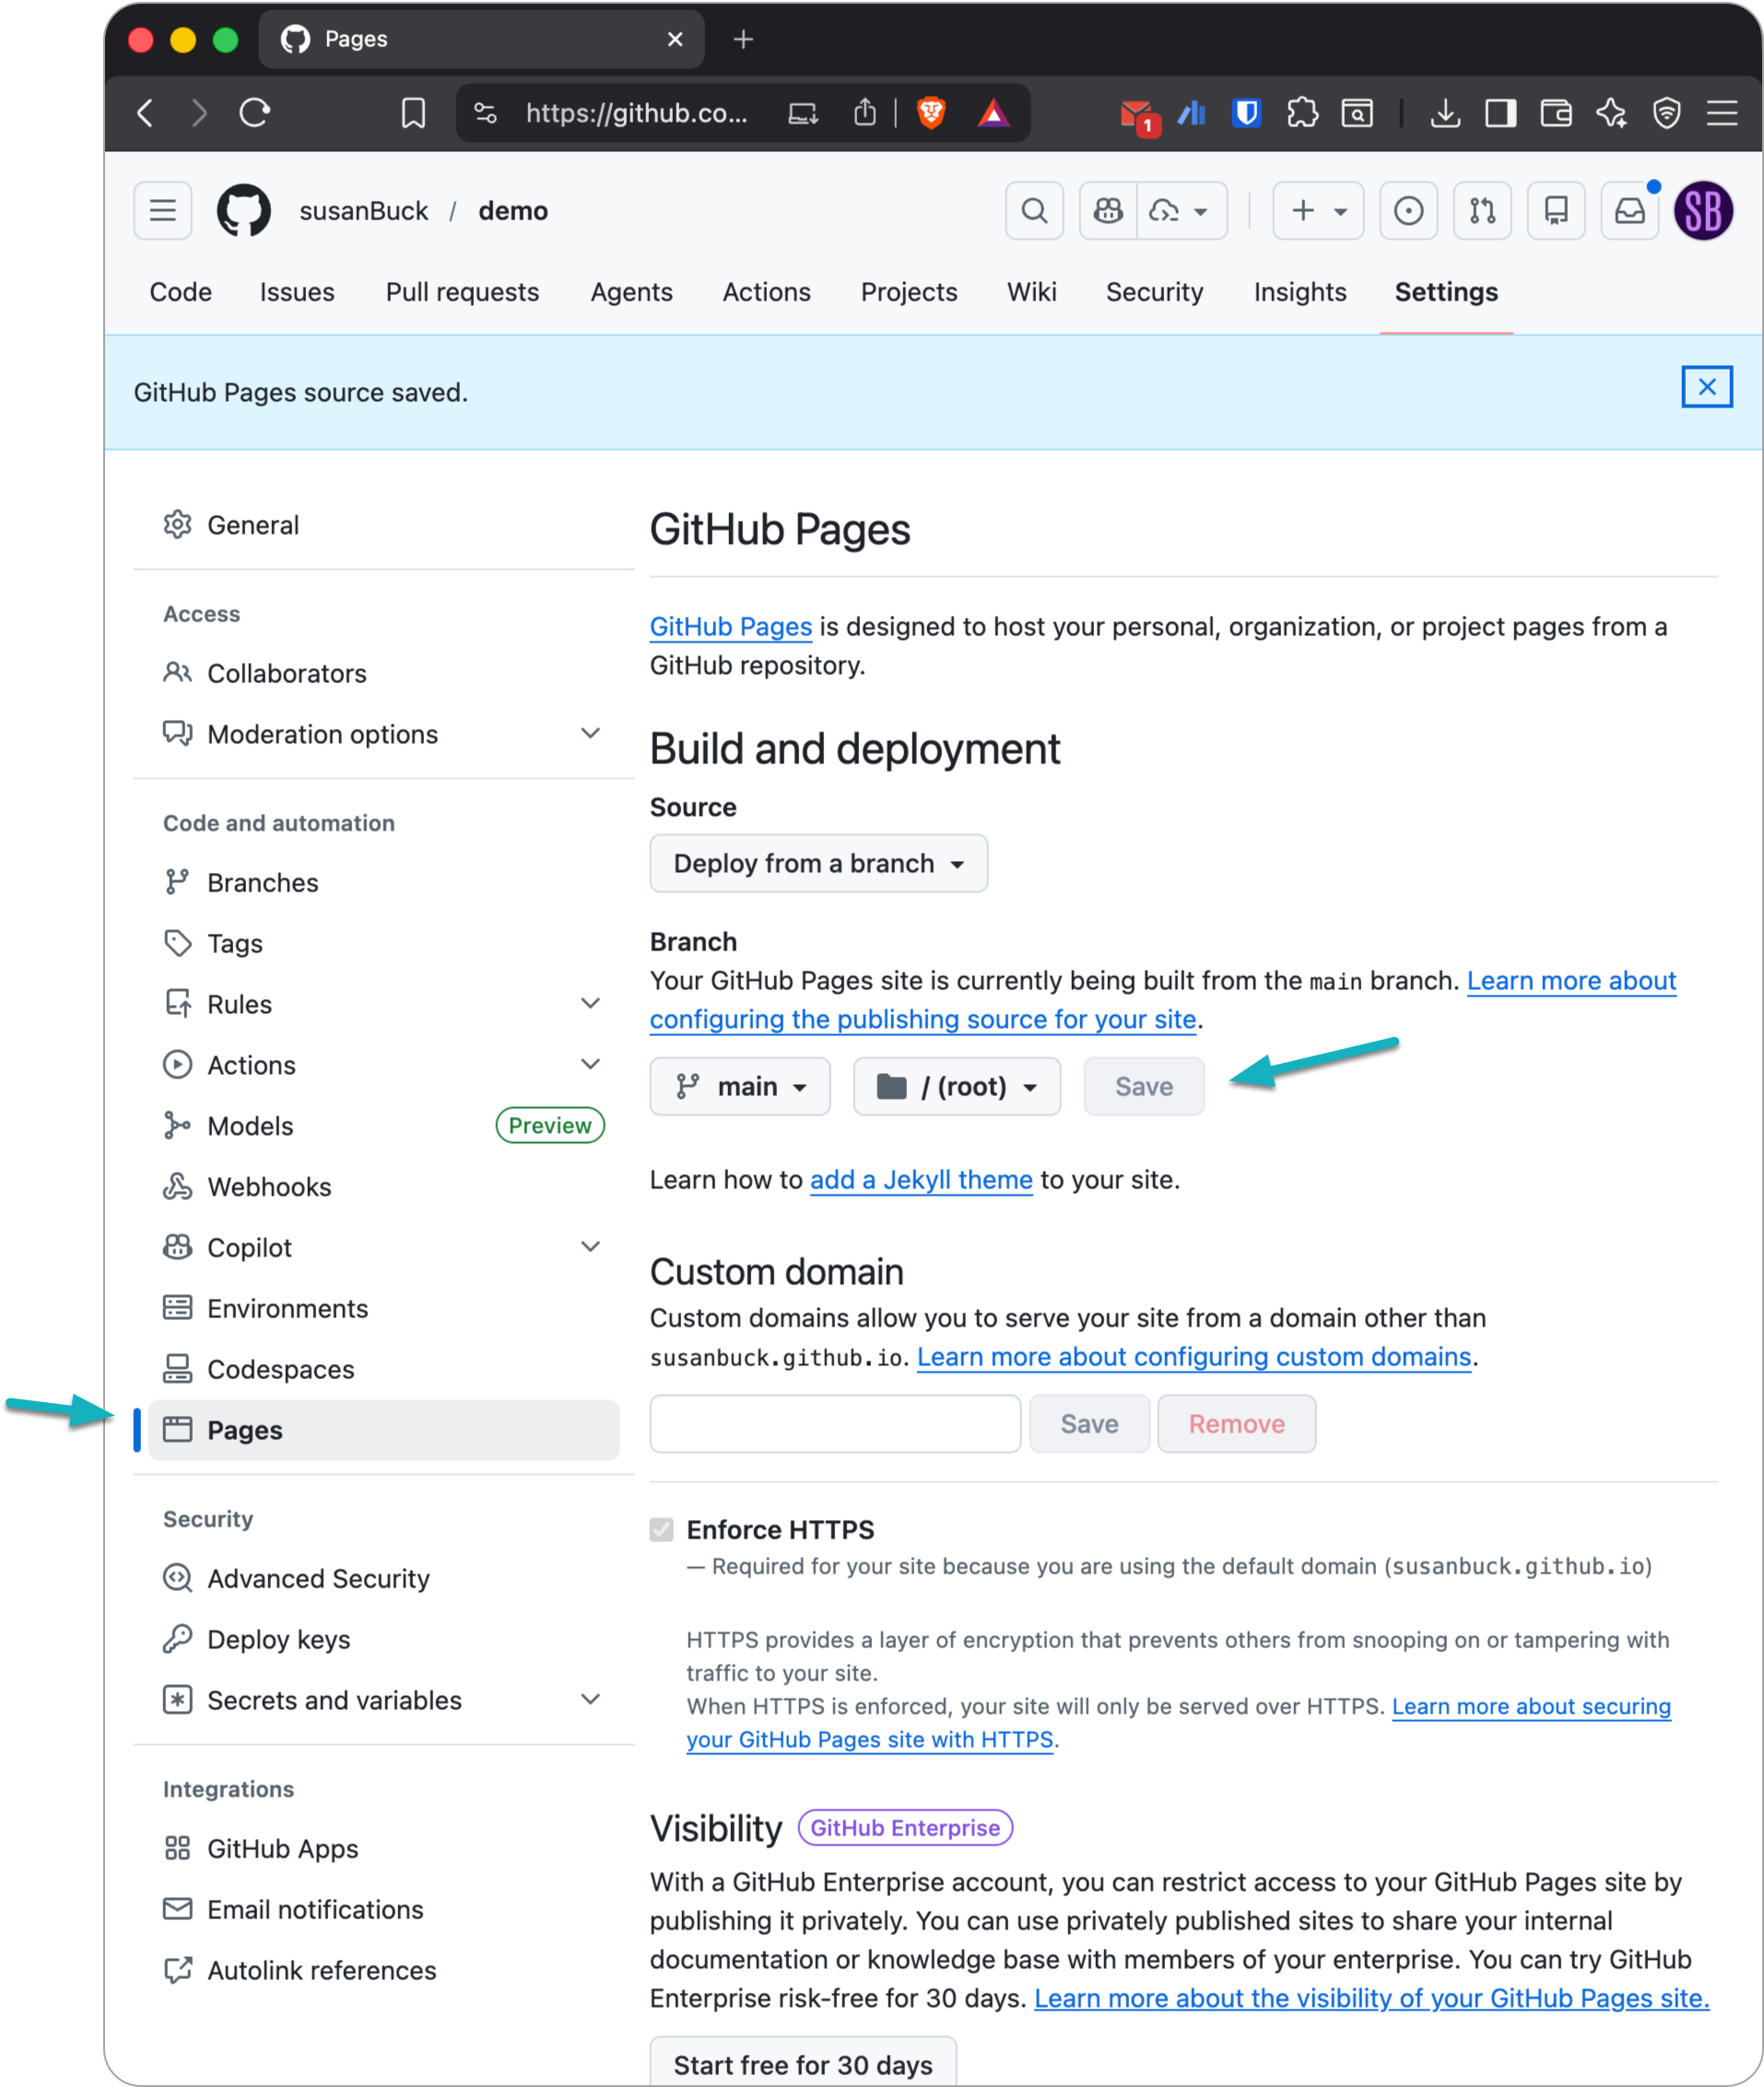
In your repository settings find Pages and change the branch to Main. E.g.:
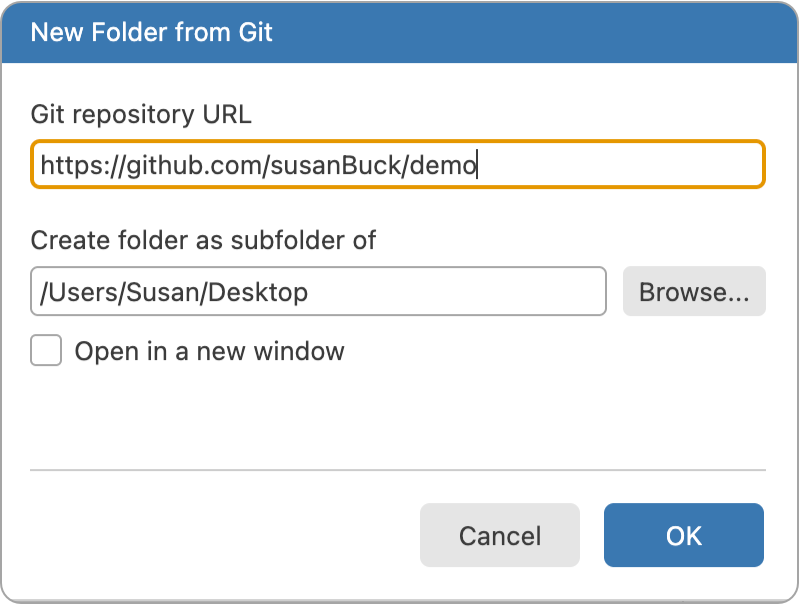
In Positron choose New > New Folder From Git and use the repository URL from the above step.
Within your new directory, create a new Quarto file called index.qmd and use the demo content provided at the end of these notes.
Click Preview and enable Render on Save to render your Quarto document.
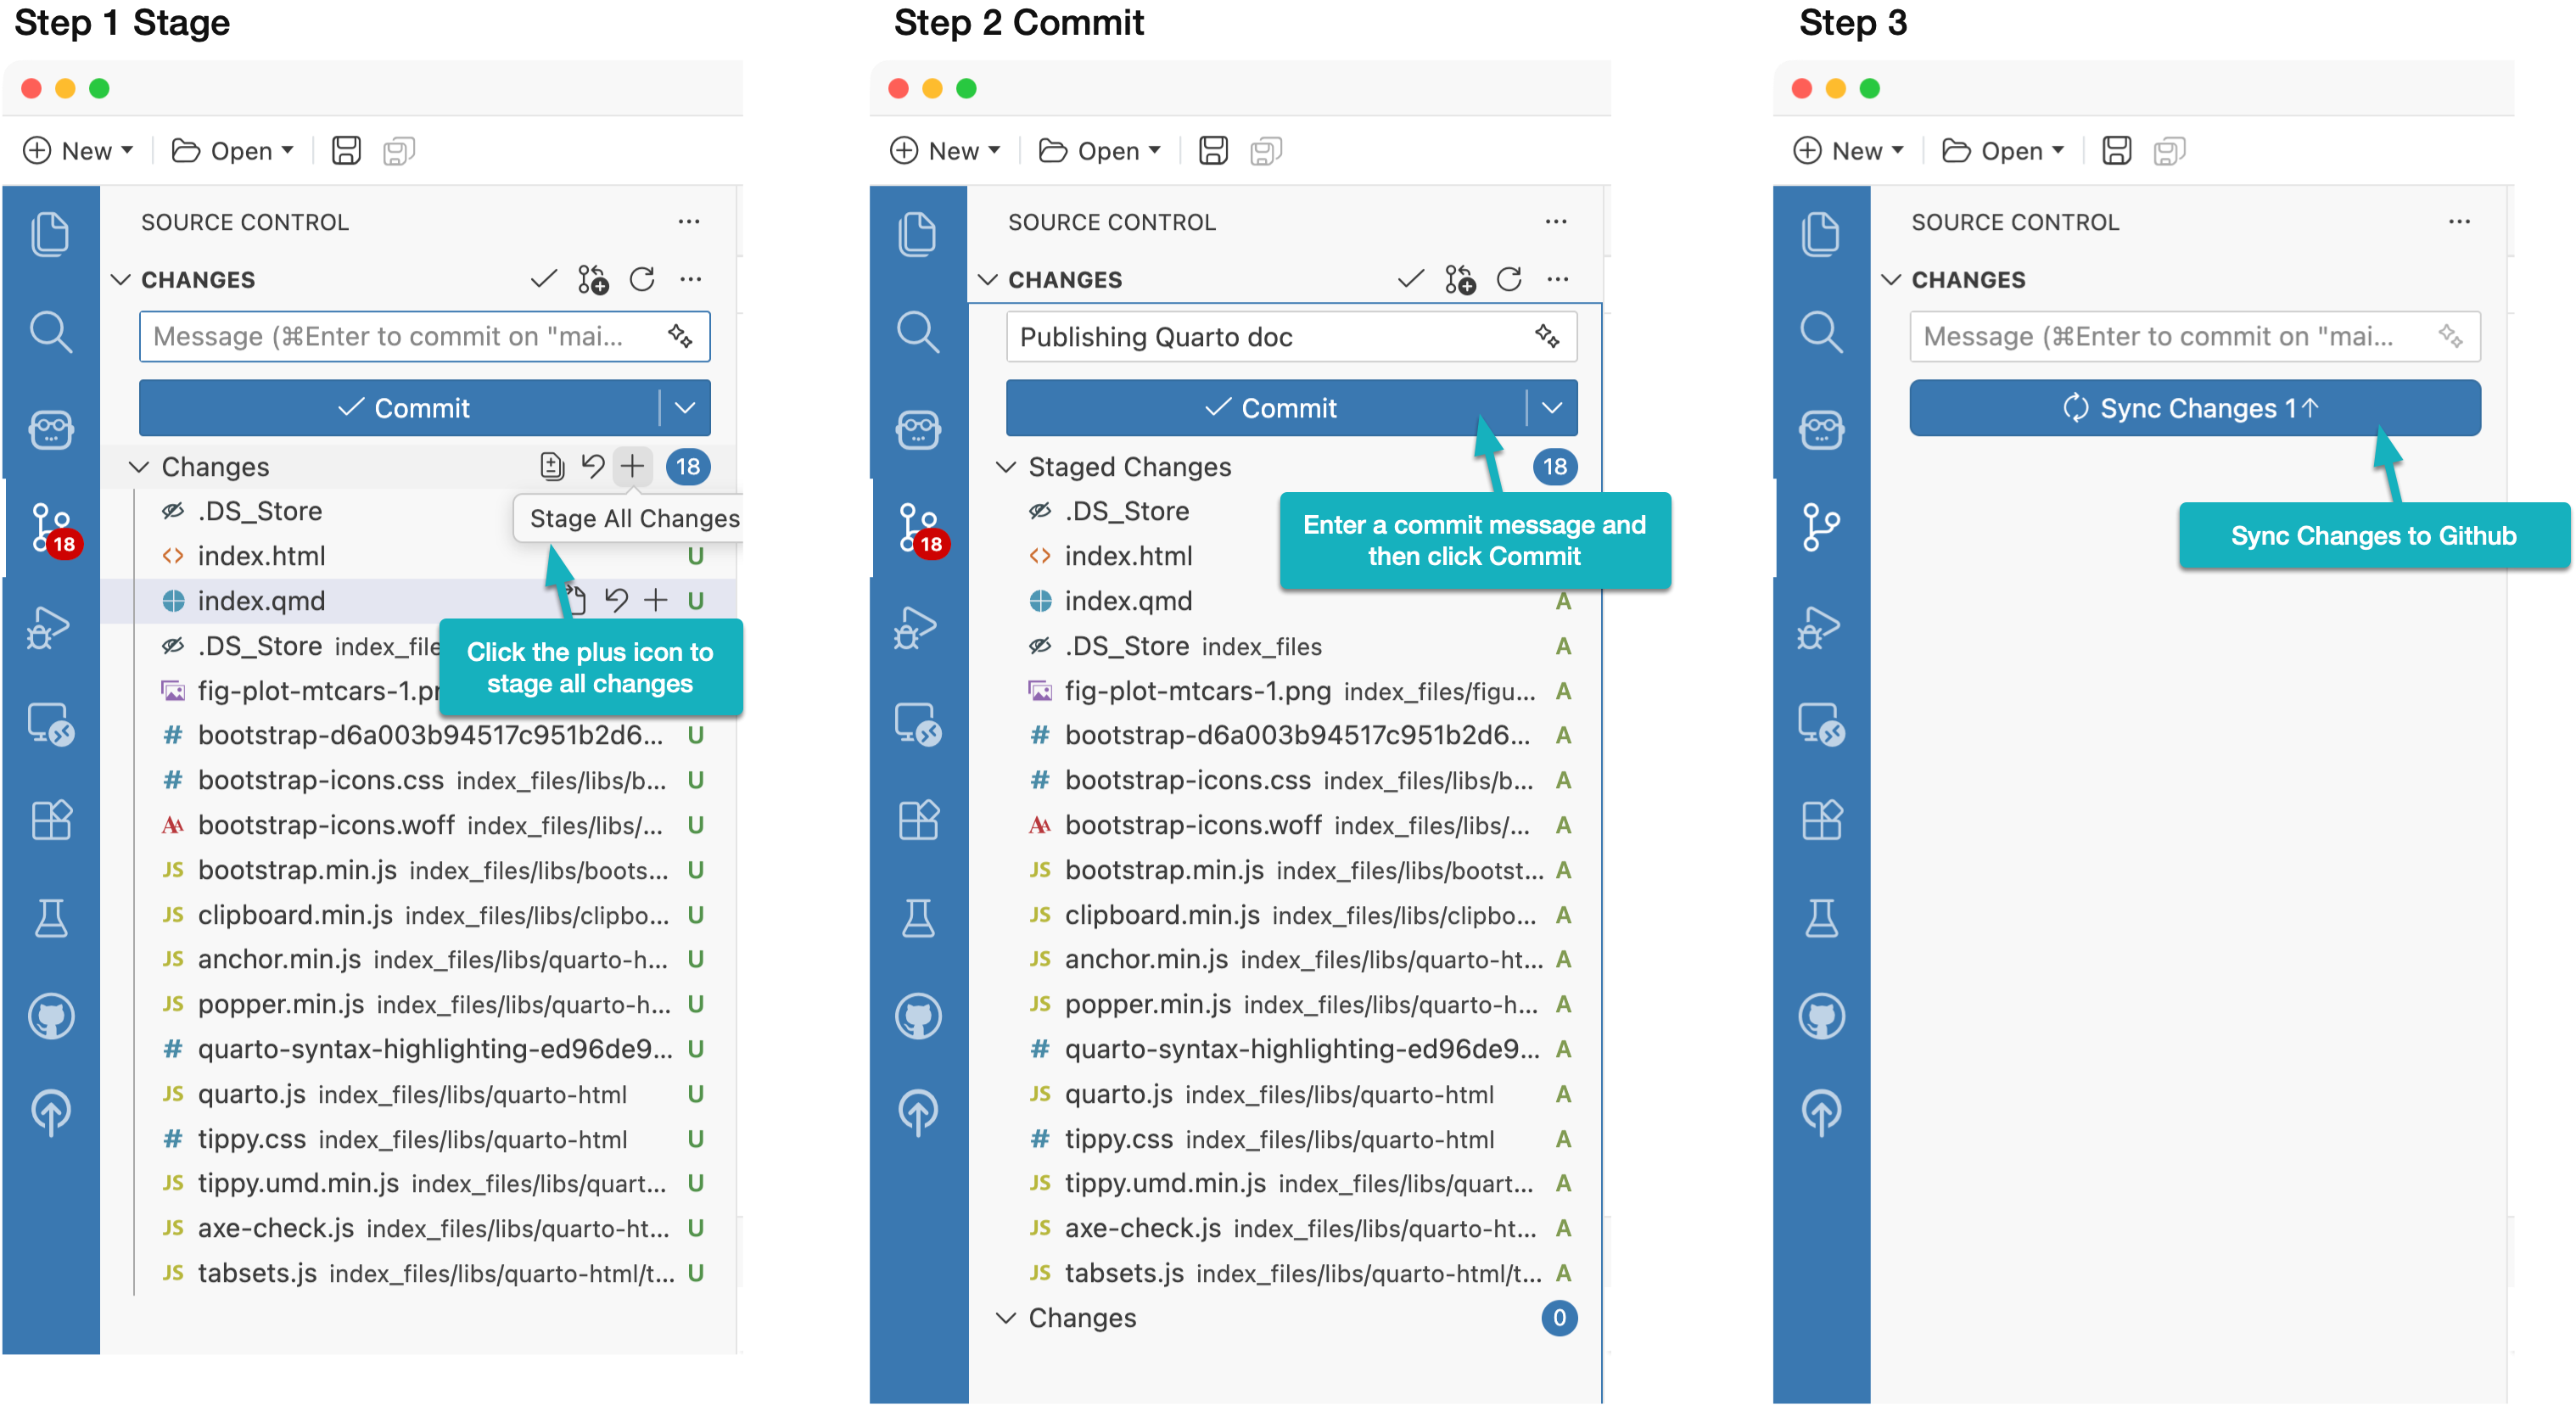
In the Source Control pane, stage, commit and deploy all active changes.
After a few moments, visit the Actions tab of your repository on Github (e.g. https://github.com/susanBuck/demo/actions). There you will find a record of pages build and deployment, which if you click, will reveal your Github pages URL.
---
title: Hello, Quarto
format: html
---

```{r}
#| include: false
library(tidyverse)
```

## Meet the cars
The [mtcars](https://www.rdocumentation.org/packages/datasets/versions/3.6.2/topics/mtcars) dataset contains fuel consumption and design characteristics for `{r} nrow(mtcars)` cars from the 1970s.

This dataset is built into R and is commonly used for teaching data analysis and visualization.

@fig-plot-mtcars shows the **relationship between a car’s weight and its fuel efficiency**.

```{r}
#| label: fig-plot-mtcars
#| fig-cap: Fuel efficiency vs weight for cars in the mtcars dataset
#| echo: false
ggplot(mtcars,
       aes(x = wt, y = mpg)) +
  geom_point(aes(color = factor(cyl)), size = 2) +
  labs(
    x = "Weight (1000 lbs)",
    y = "Miles per gallon",
    color = "Number of cylinders"
  ) +
  theme_minimal()
```

## Compute Pearson Correlation
We compute the Pearson correlation coefficient between vehicle weight (wt) and fuel efficiency (mpg) to quantify the linear relationship shown in the plot. Pearson's $r$ ranges from $-1$ to $1$; a negative value indicates heavier cars tend to have lower mpg. The computed value helps assess the strength and direction of this association.

```{r}
cor_mpg_wt <- cor(mtcars$wt, mtcars$mpg, method = "pearson")
cor_mpg_wt
```
No subscriptions, no auto-renewals.
Just a simple one-time payment that helps support my free, to-the-point videos without sponsered ads.
Unlocking gets you access to the notes for this video plus all 200+ guides on this site.
Your support is appreciated. Thank you!
 How to Manage Settings in Positron
 Fully Remove Positron from Mac (Clean Reinstall Guide)
 How to Set Up and Use AI Features in Positron