Quarto allows you to create documents that combine code, narrative text, and output (such as plots and figures).
Quarto files can be rendered as websites (HTML), documents (PDF, Word), presentations, and even books. Once rendered, these outputs are easy to share, which makes Quarto especially well suited for data science publishing and reproducible research.
Check out a gallery of Quarto examples here...
Follow-up Guide: Host Quarto Reports on GitHub Pages for Free
To get started with Quarto in Positron, create a new folder called demo. Inside this folder, create a new file named demo.qmd and paste in the following example code:
---
title: Hello, Quarto
format: html
---

```{r}
#| include: false
library(tidyverse)
```

## Meet the cars
The [mtcars](https://www.rdocumentation.org/packages/datasets/versions/3.6.2/topics/mtcars) dataset contains fuel consumption and design characteristics for `{r} nrow(mtcars)` cars from the 1970s.

This dataset is built into R and is commonly used for teaching data analysis and visualization.

@fig-plot-mtcars shows the **relationship between a car’s weight and its fuel efficiency**.

```{r}
#| label: fig-plot-mtcars
#| fig-cap: Fuel efficiency vs weight for cars in the mtcars dataset
#| echo: false
ggplot(mtcars,
       aes(x = wt, y = mpg)) +
  geom_point(aes(color = factor(cyl)), size = 2) +
  labs(
    x = "Weight (1000 lbs)",
    y = "Miles per gallon",
    color = "Number of cylinders"
  ) +
  theme_minimal()
```

## Compute Pearson Correlation
We compute the Pearson correlation coefficient between vehicle weight (wt) and fuel efficiency (mpg) to quantify the linear relationship shown in the plot. Pearson's $r$ ranges from $-1$ to $1$; a negative value indicates heavier cars tend to have lower mpg. The computed value helps assess the strength and direction of this association.

```{r}
cor_mpg_wt <- cor(mtcars$wt, mtcars$mpg, method = "pearson")
cor_mpg_wt
```
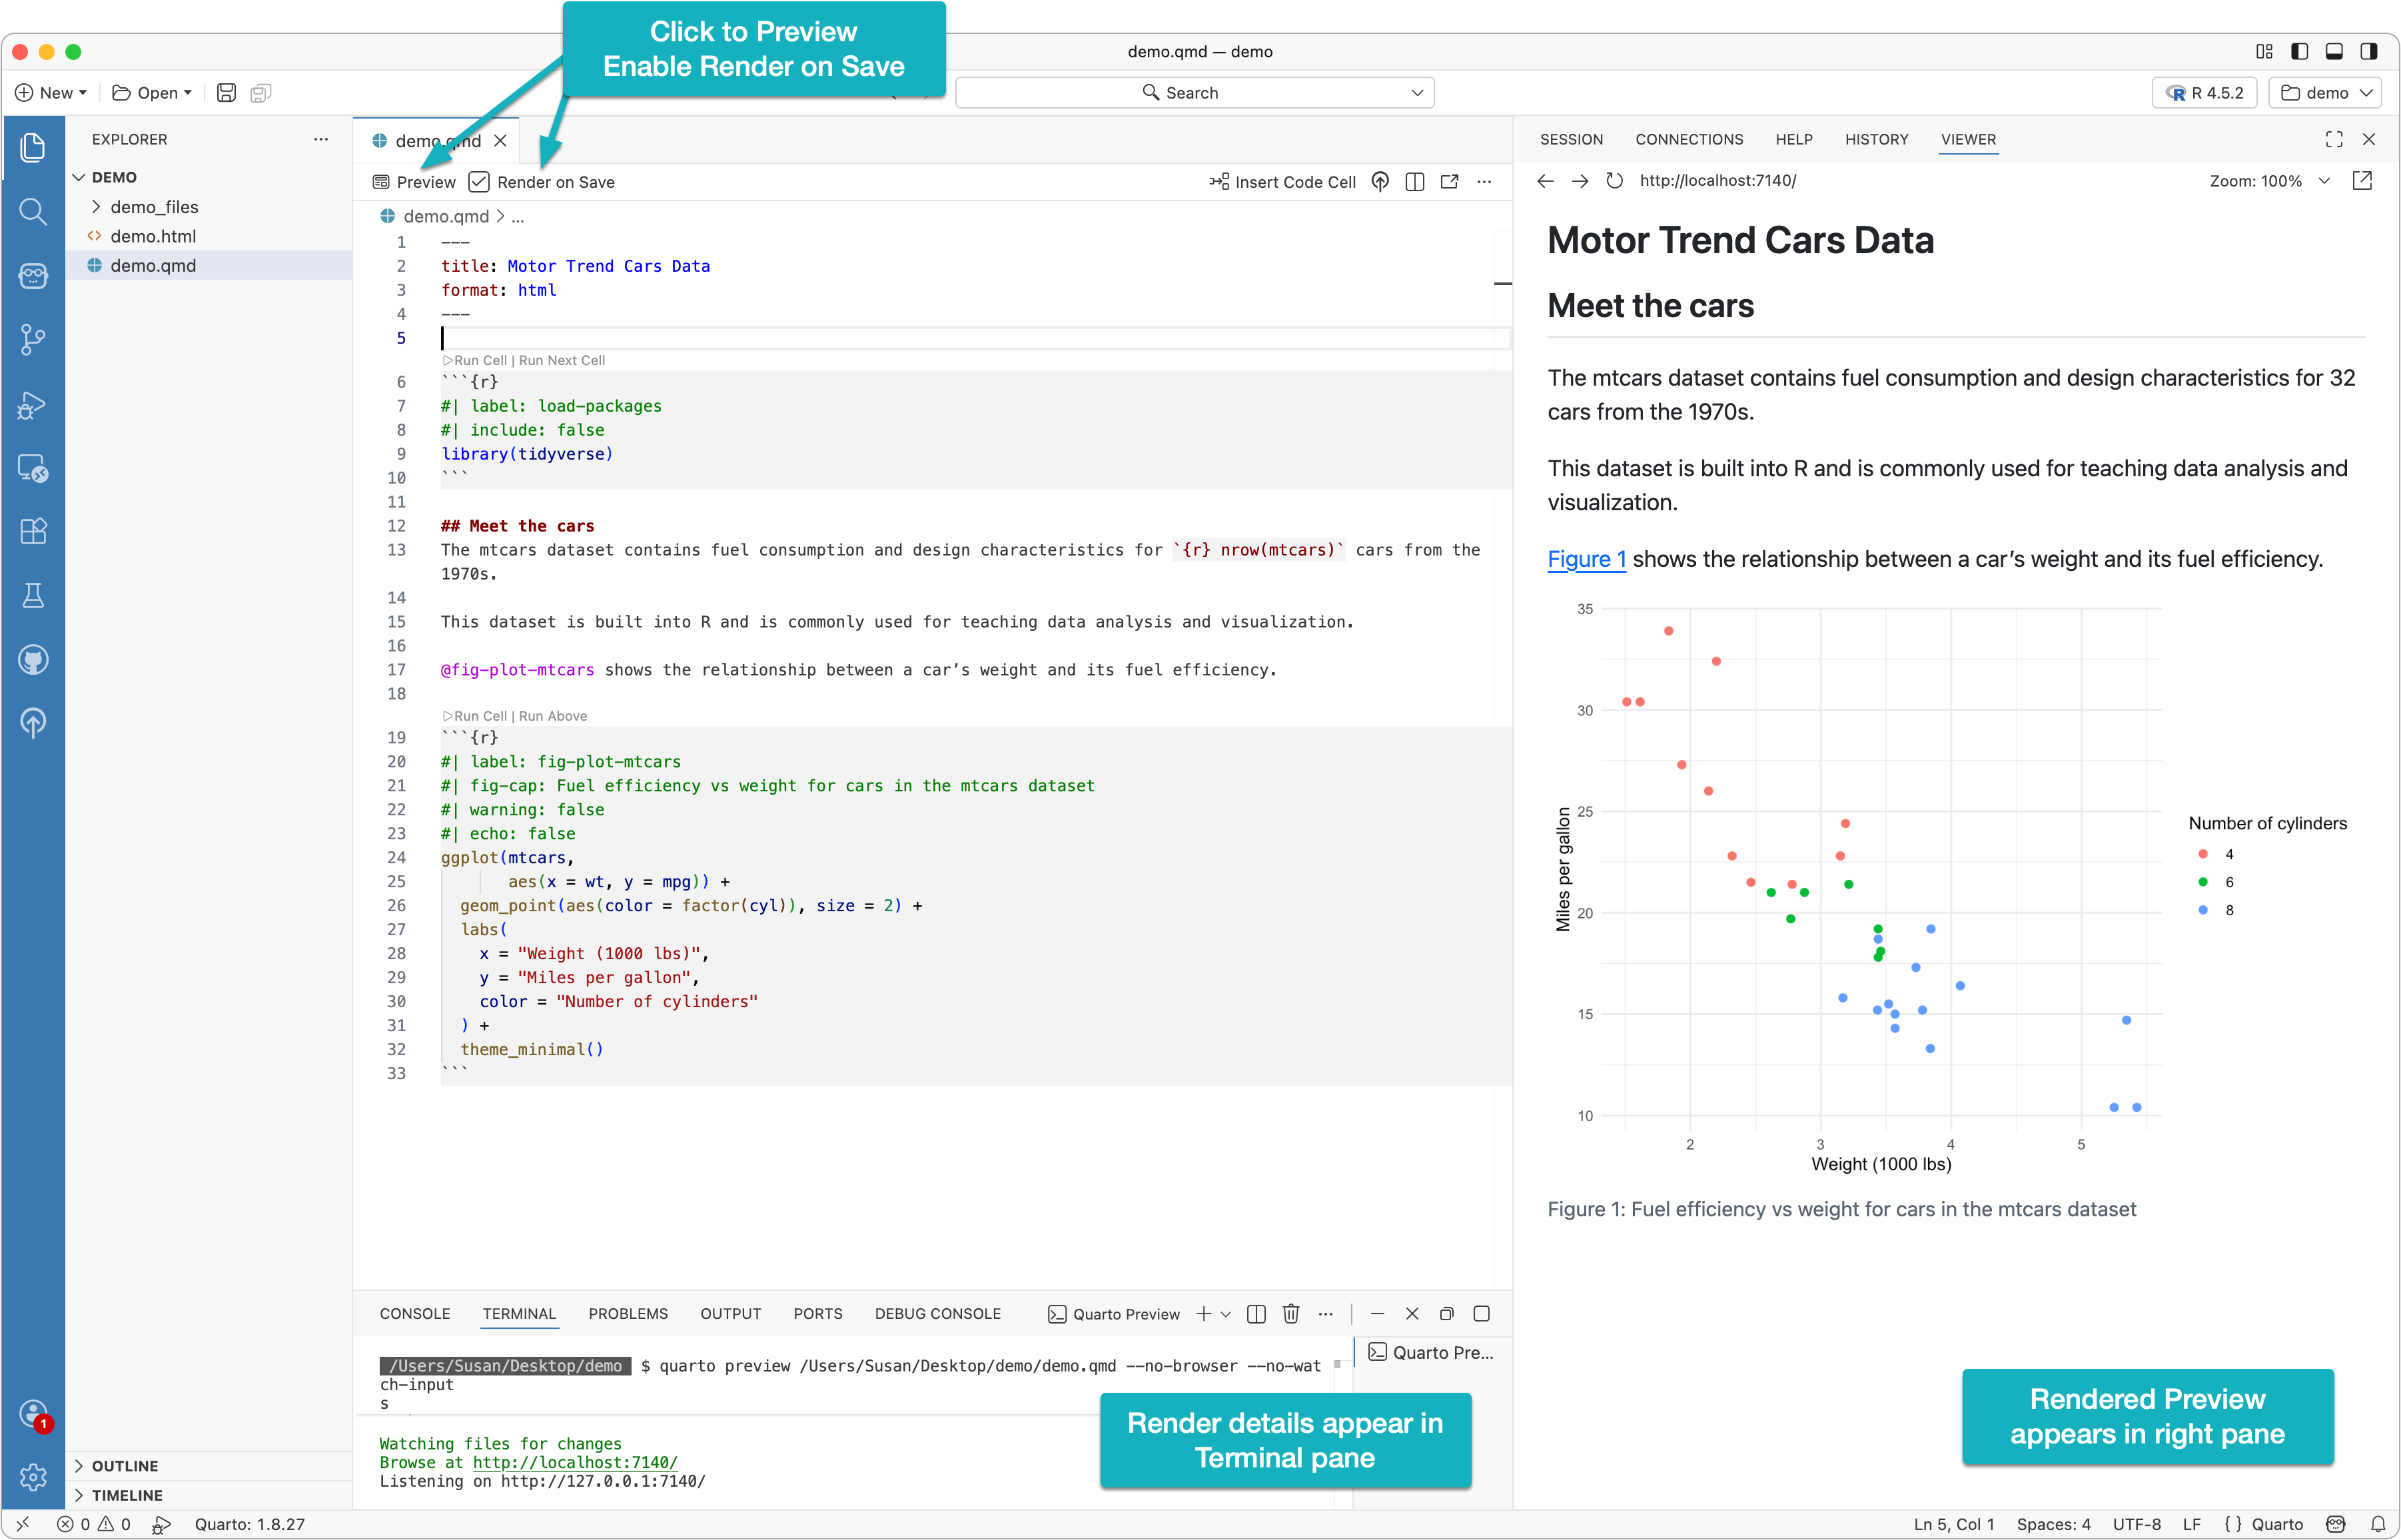
Click Preview, then enable Render on Save. As the document renders, you will see details of the rendering process in the Terminal pane at the bottom, followed by a preview of the rendered output in the right pane.
At the top of a Quarto file is the document header, marked by three dashes (---) at the beginning and end.
---
title: Motor Trend Cars Data
format: html
---
This section is called the YAML front matter. It defines document-level options using YAML, a human-readable data format which is written as key–value pairs in the form key: value.
In this example, the title is set to Motor Trend Cars Data and the format is set to html. When the document is rendered, the title appears at the top of the output in a larger font size. The format field tells Quarto what type of output to generate.
Front matter can also include additional metadata such as author, subtitle, and date, as well as formatting and layout options like themes, colors, figure sizing, and typography. The available options depend on the chosen output format and are documented in Quarto’s reference materials.
Markdown is used to format the narrative of your document. It is a lightweight markup language that lets you add structure and formatting using simple syntax.
This example uses Markdown to create a heading:
## Meet the cars
A link:
[mtcars](https://www.rdocumentation.org/packages/datasets/versions/3.6.2/topics/mtcars)
Bold text:
**relationship between a car’s weight and its fuel efficiency**
If you’re new to Markdown, skim the Markdown basics guide to get comfortable with the syntax.
In Quarto documents, code cells are used to execute code directly within the document.
```{r}
#| include: false
library(tidyverse)
```
The triple backticks mark the start and end of the code cell, and the language name inside the braces tells Quarto what engine to use to run the code. Cell options can be added using the #| syntax, which is known as comment-based cell options.
In this example, the include: false option tells Quarto to run the code but exclude both the code and its output from the rendered document. Change include to true and re-render to see the difference.
Another code cell in this document is:
```{r}
#| label: fig-plot-mtcars
#| fig-cap: Fuel efficiency vs weight for cars in the mtcars dataset
#| echo: false
ggplot(mtcars,
       aes(x = wt, y = mpg)) +
  geom_point(aes(color = factor(cyl)), size = 2) +
  labs(
    x = "Weight (1000 lbs)",
    y = "Miles per gallon",
    color = "Number of cylinders"
  ) +
  theme_minimal()
```
Here, the echo: false option hides the code while still displaying its output. This is useful when you want readers to focus on results rather than implementation details.
The final code cell in this example is:
```{r}
cor_mpg_wt <- cor(mtcars$wt, mtcars$mpg, method = "pearson")
cor_mpg_wt
```
Because neither echo: false nor include: false is used, both the code and its output appear in the rendered document. This approach is appropriate when you want readers to see exactly how a value was computed, supporting transparency and reproducibility.
Returning to the narrative text, note how a small code expression is embedded directly into a sentence using inline code:
[...] fuel consumption and design characteristics for `{r} nrow(mtcars)` cars from the 1970s.
The backticks indicate inline code. Inside the backticks, {r} tells Quarto to evaluate the expression using the R engine, and nrow(mtcars) is the code that gets executed. When rendered, Quarto replaces the inline code with the computed value.
In Quarto, a cross reference lets you link to a numbered element in your document (such as a figure, table, section, or equation) using an automatically generated label.
For example, the plot in this demo had a label fig-plot-mtcars:
```{r}
#| label: fig-plot-mtcars
#| fig-cap: Fuel efficiency vs weight for cars in the mtcars dataset
#| echo: false
ggplot([...])
```
Which was referenced in the narrative via an @:
@fig-plot-mtcars shows the **relationship between a car’s weight and its fuel efficiency**.
Quarto can produce a wide range of shareable output formats from the same source document. Common examples include:
Rendering HTML
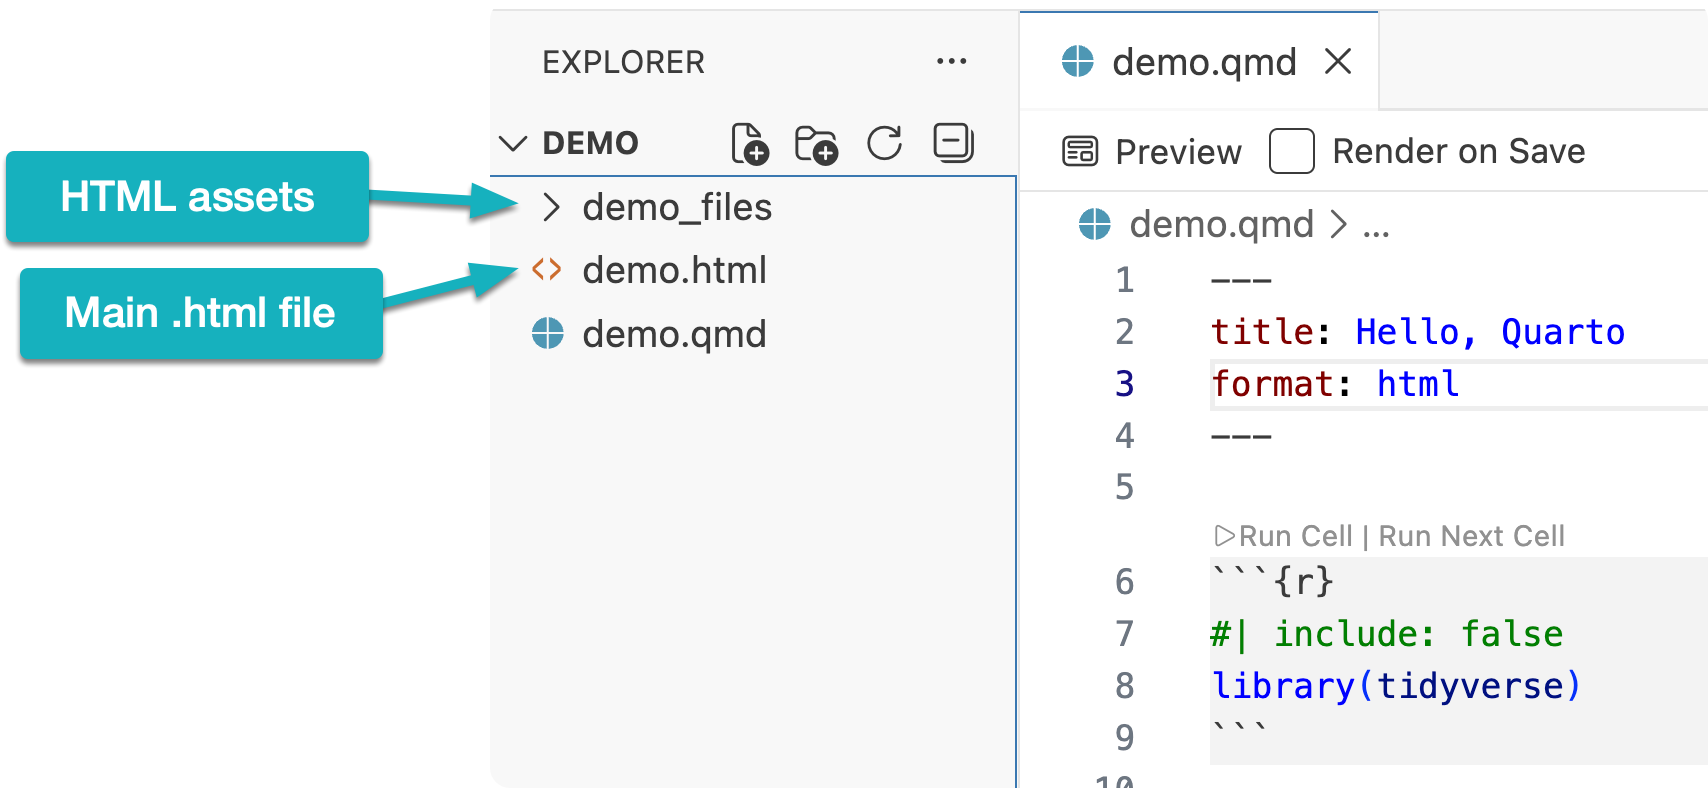
Rendering to HTML creates a .html file along with an accompanying assets folder, both of which should be uploaded to a web server to be shared publically.
To share your reports publicly, see my guide on publishing Quarto reports to GitHub Pages for free.
Rendering PDF
In order to create PDFs you will need to install a recent distribution of TeX, which can be done via this command in the Terminal:
quarto install tinytex
After completing the above step, follow the same procedures as you did for rendering HTML, instead choosing PDF as your output format.
Rendering to PDF creates a single .pdf file containing the full report.
No subscriptions, no auto-renewals.
Just a simple one-time payment that helps support my free, to-the-point videos without sponsered ads.
Unlocking gets you access to the notes for this video plus all 200+ guides on this site.
Your support is appreciated. Thank you!
 Goodbye RStudio, Hello Positron
 Git Version Control in Positron
 Host Quarto Reports on GitHub Pages for Free